Step 01
Overlapping photographs
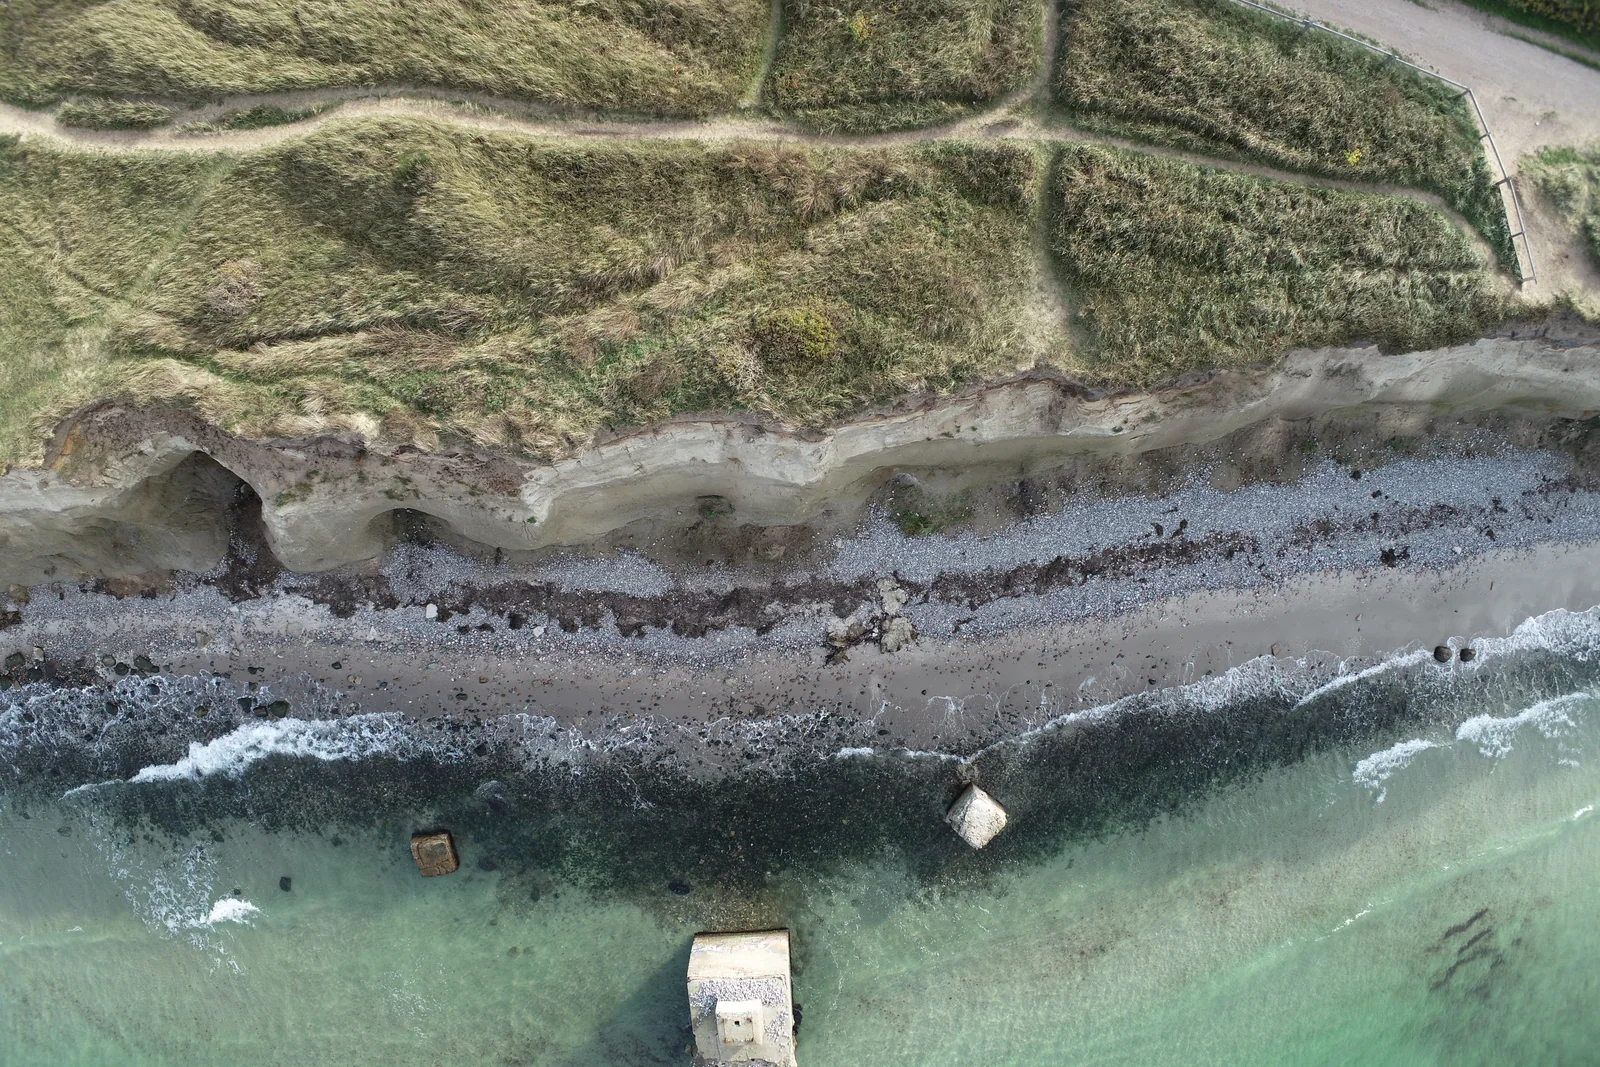
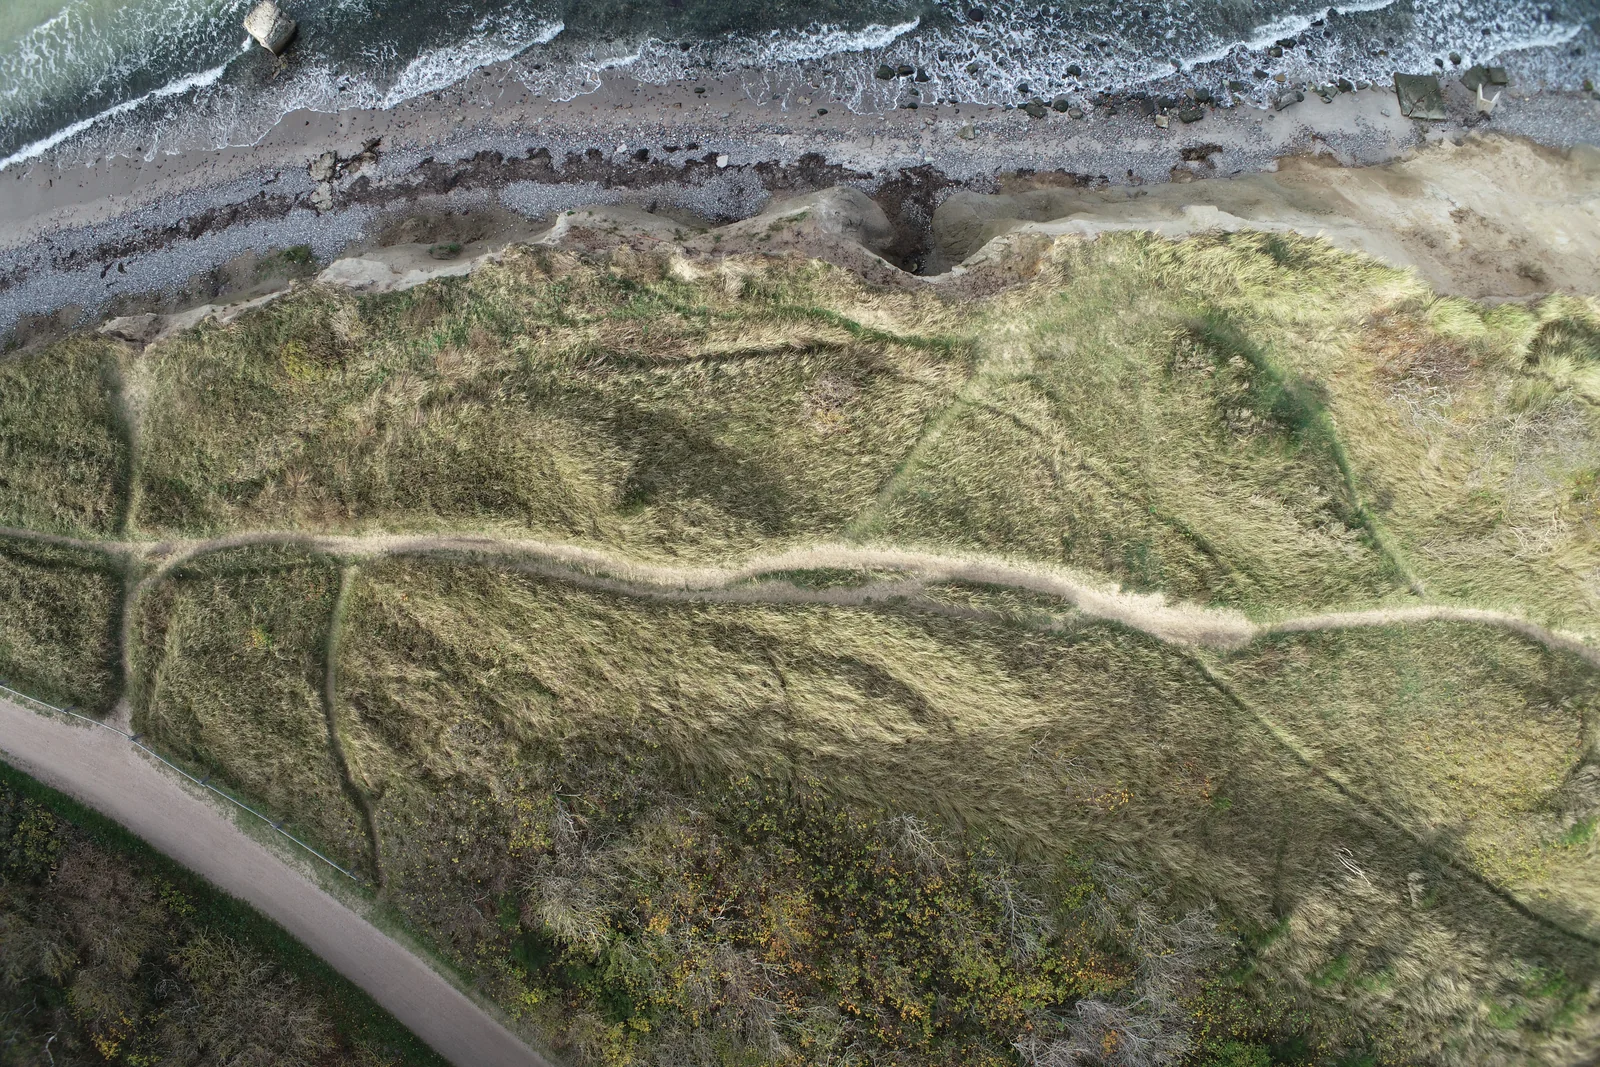
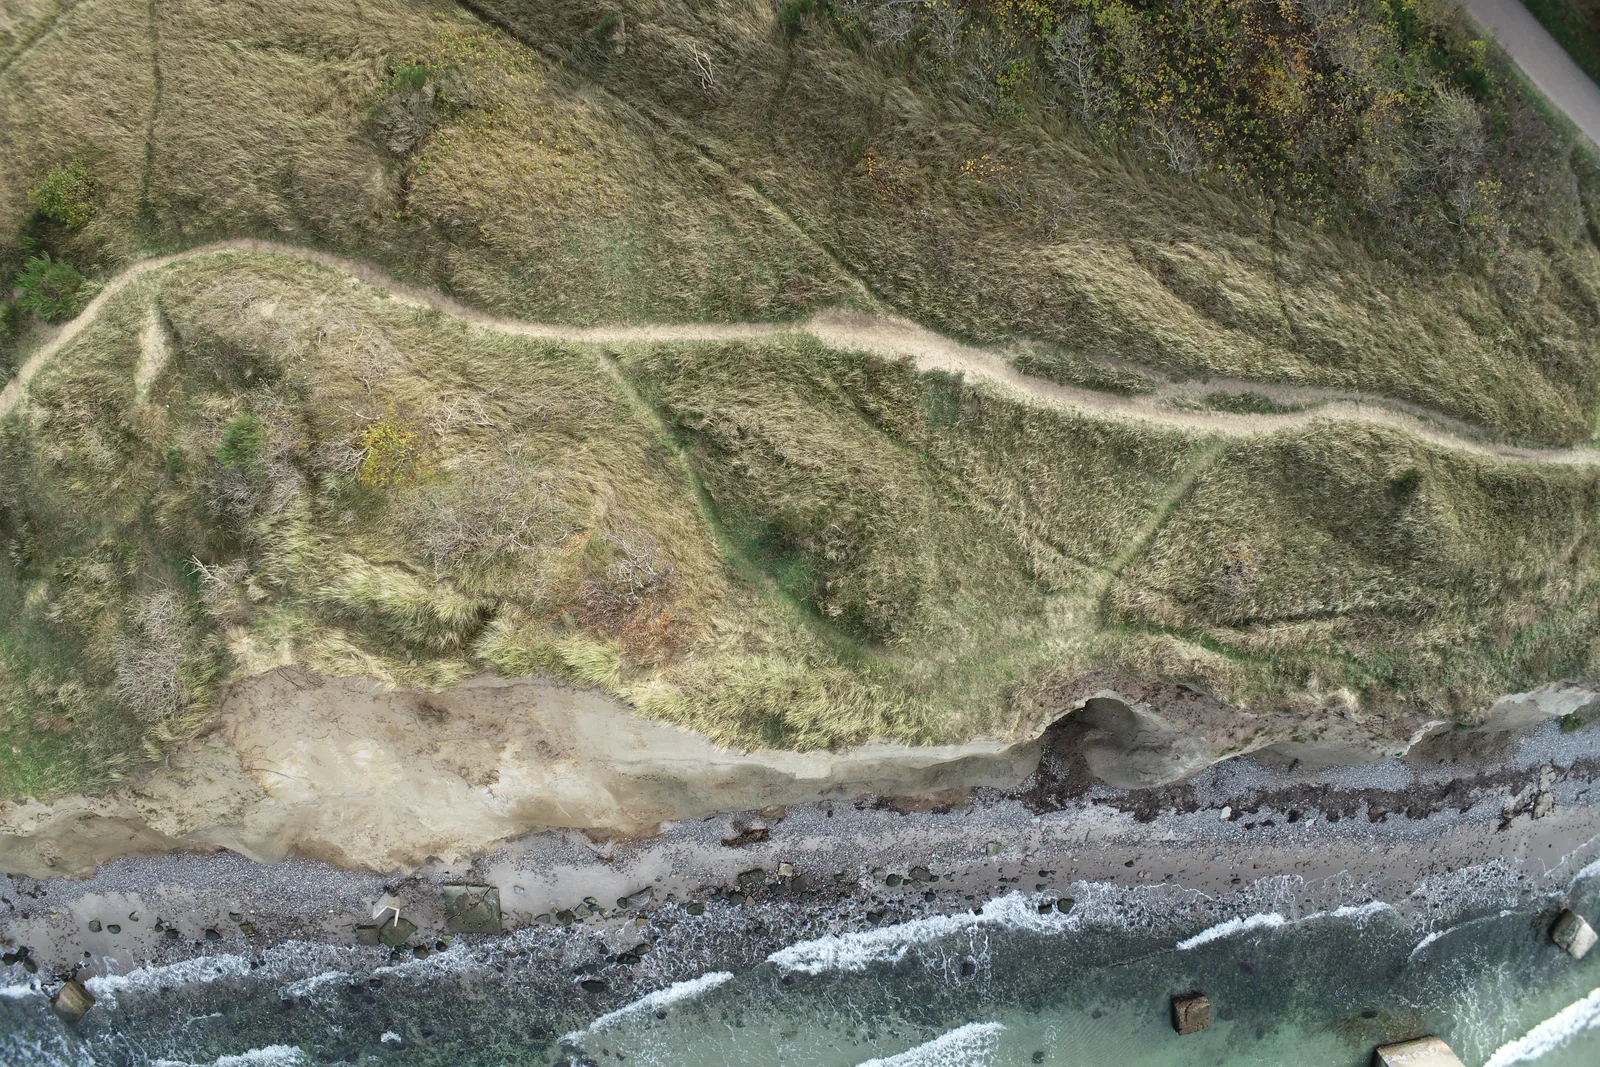
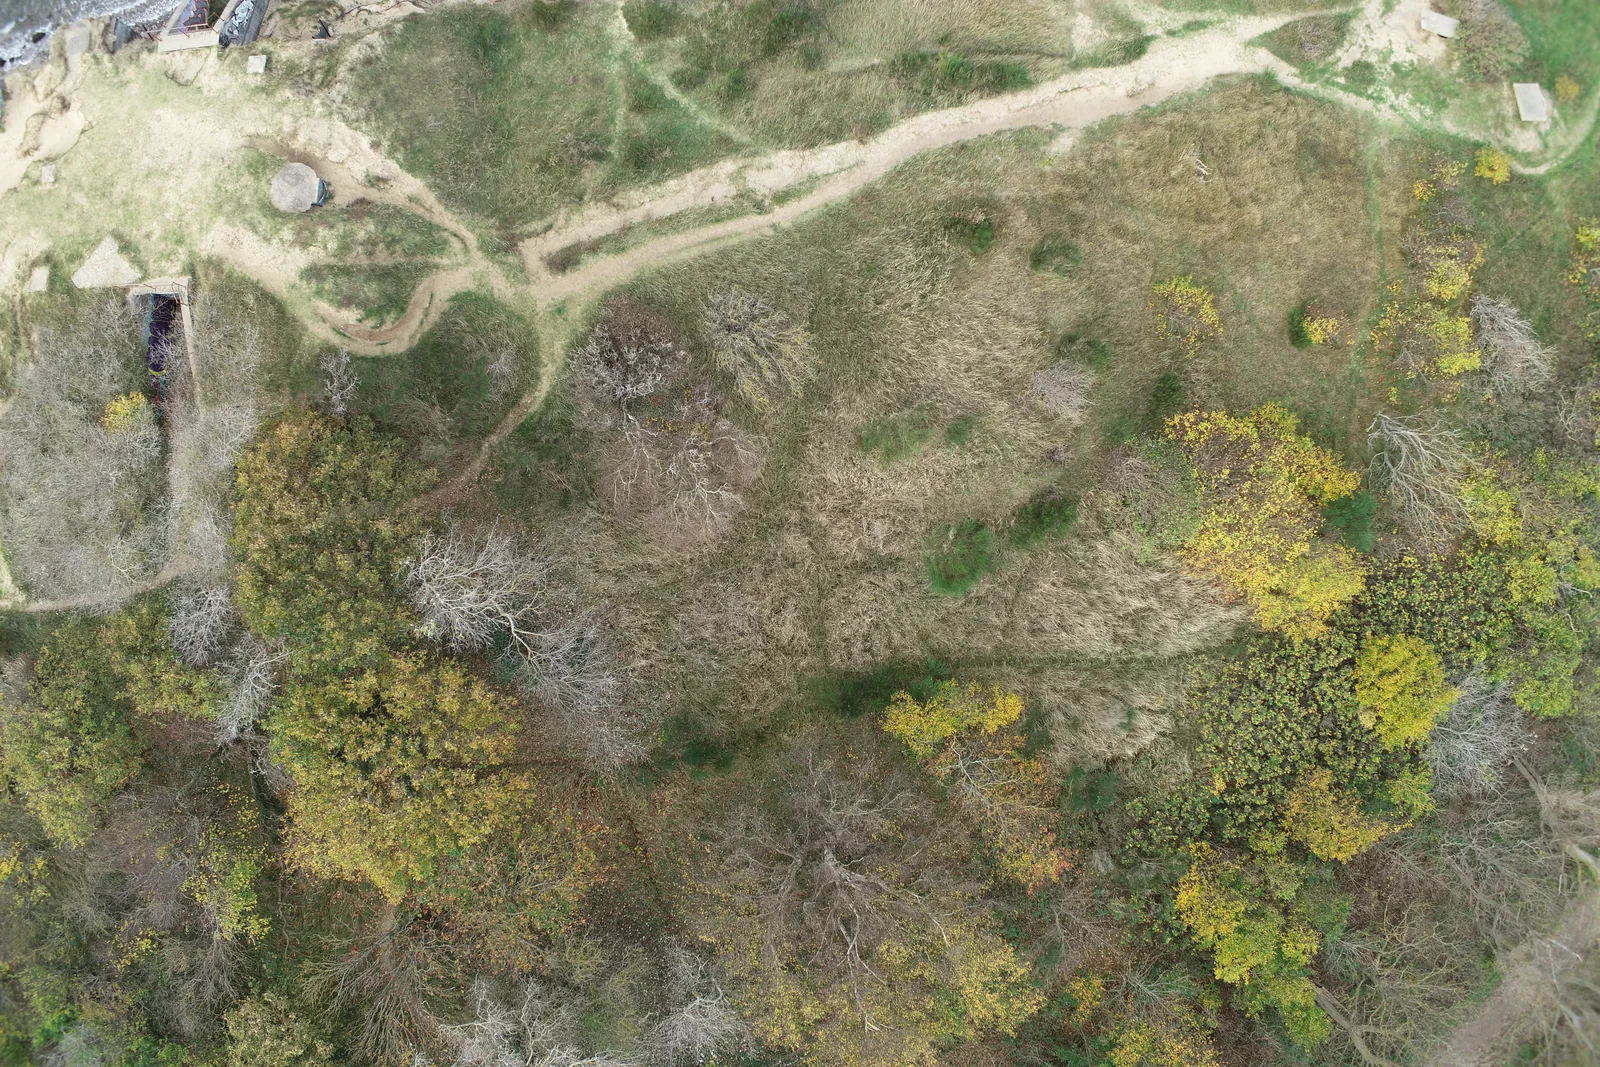
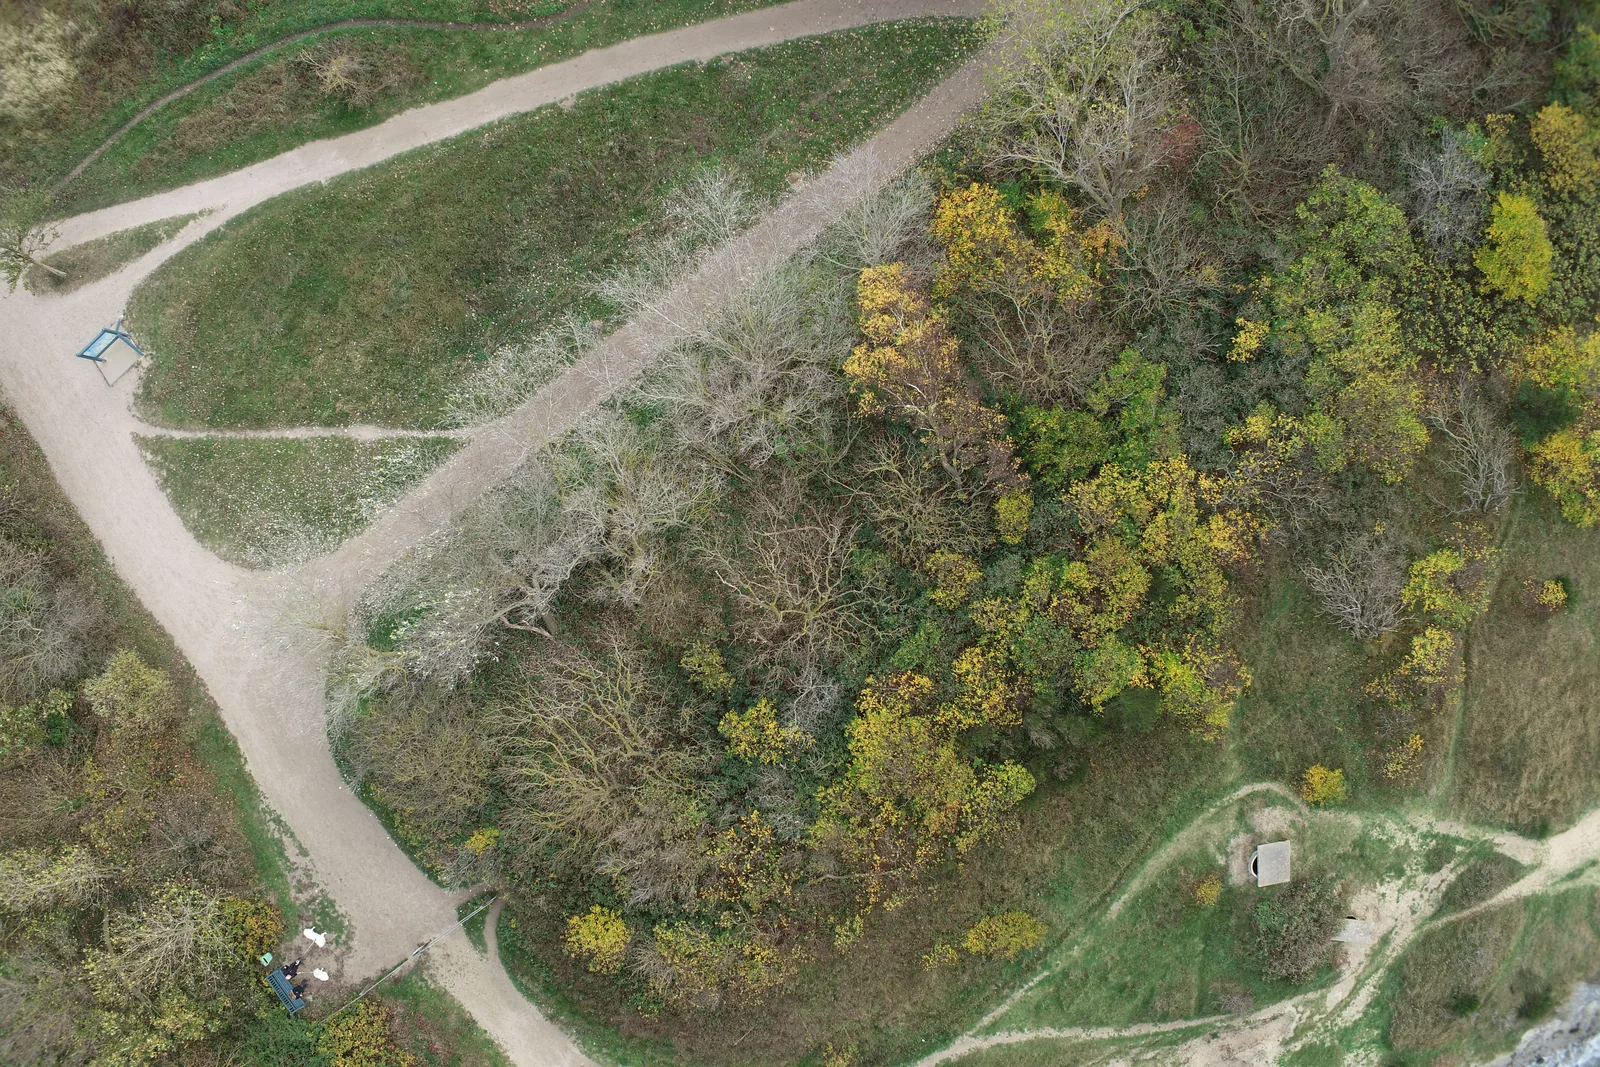
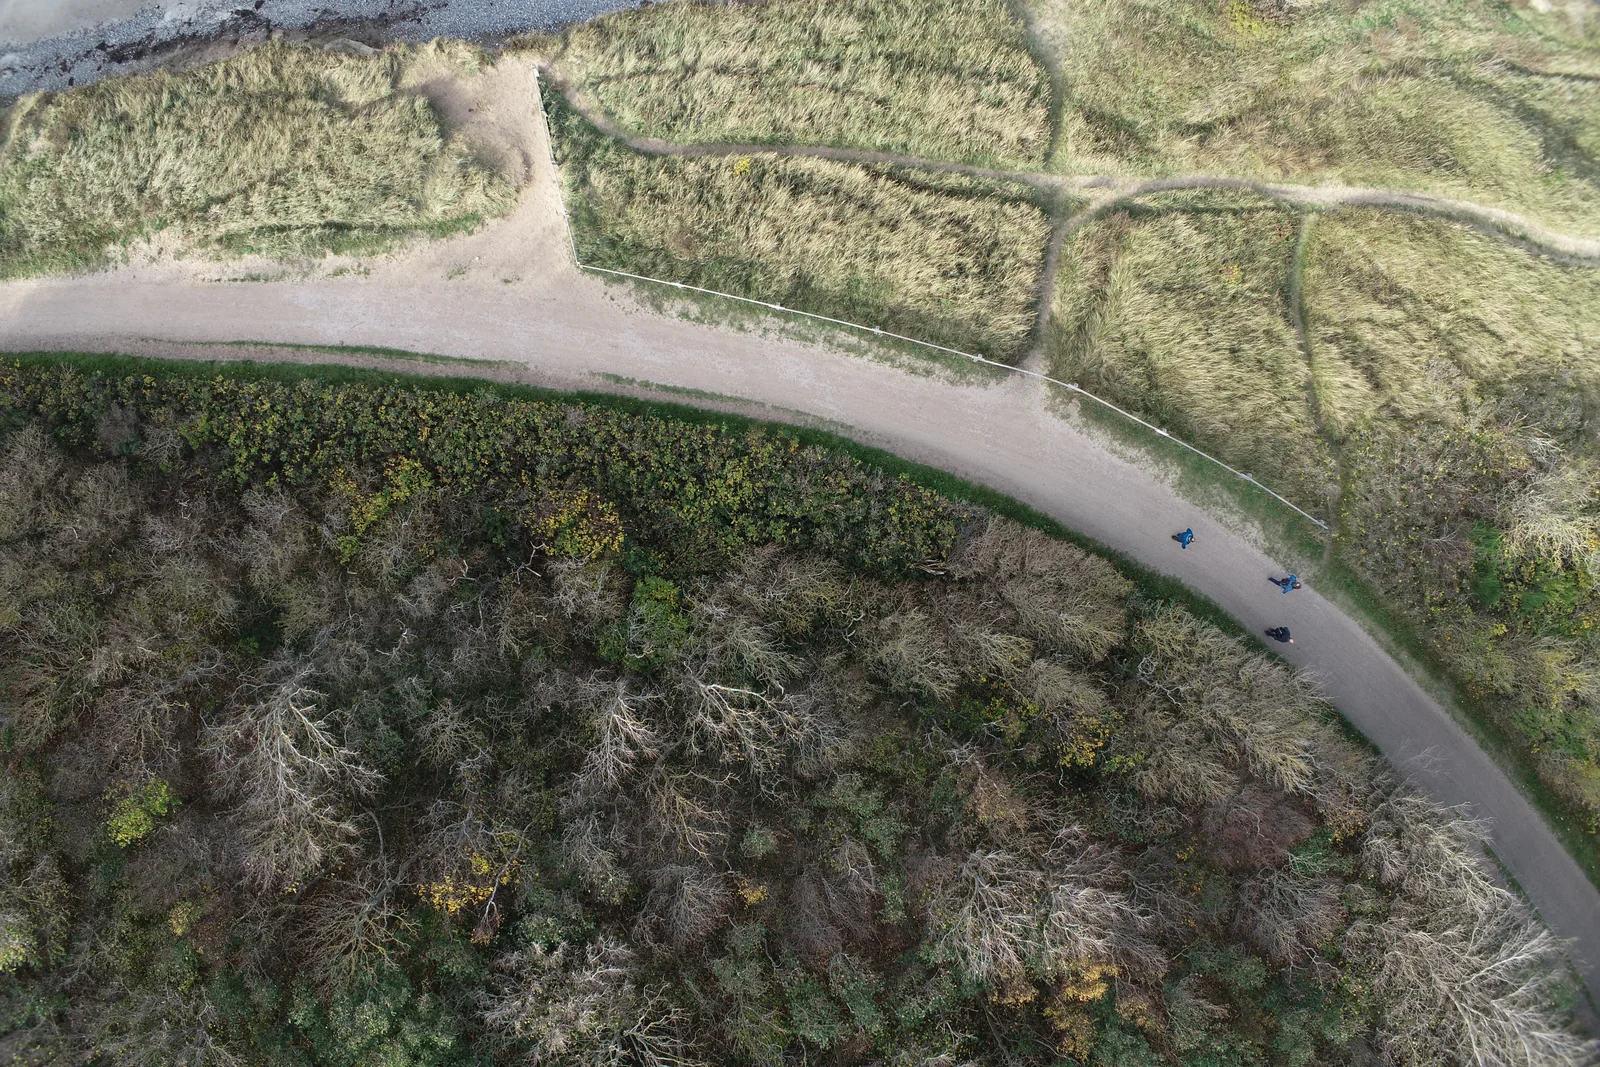
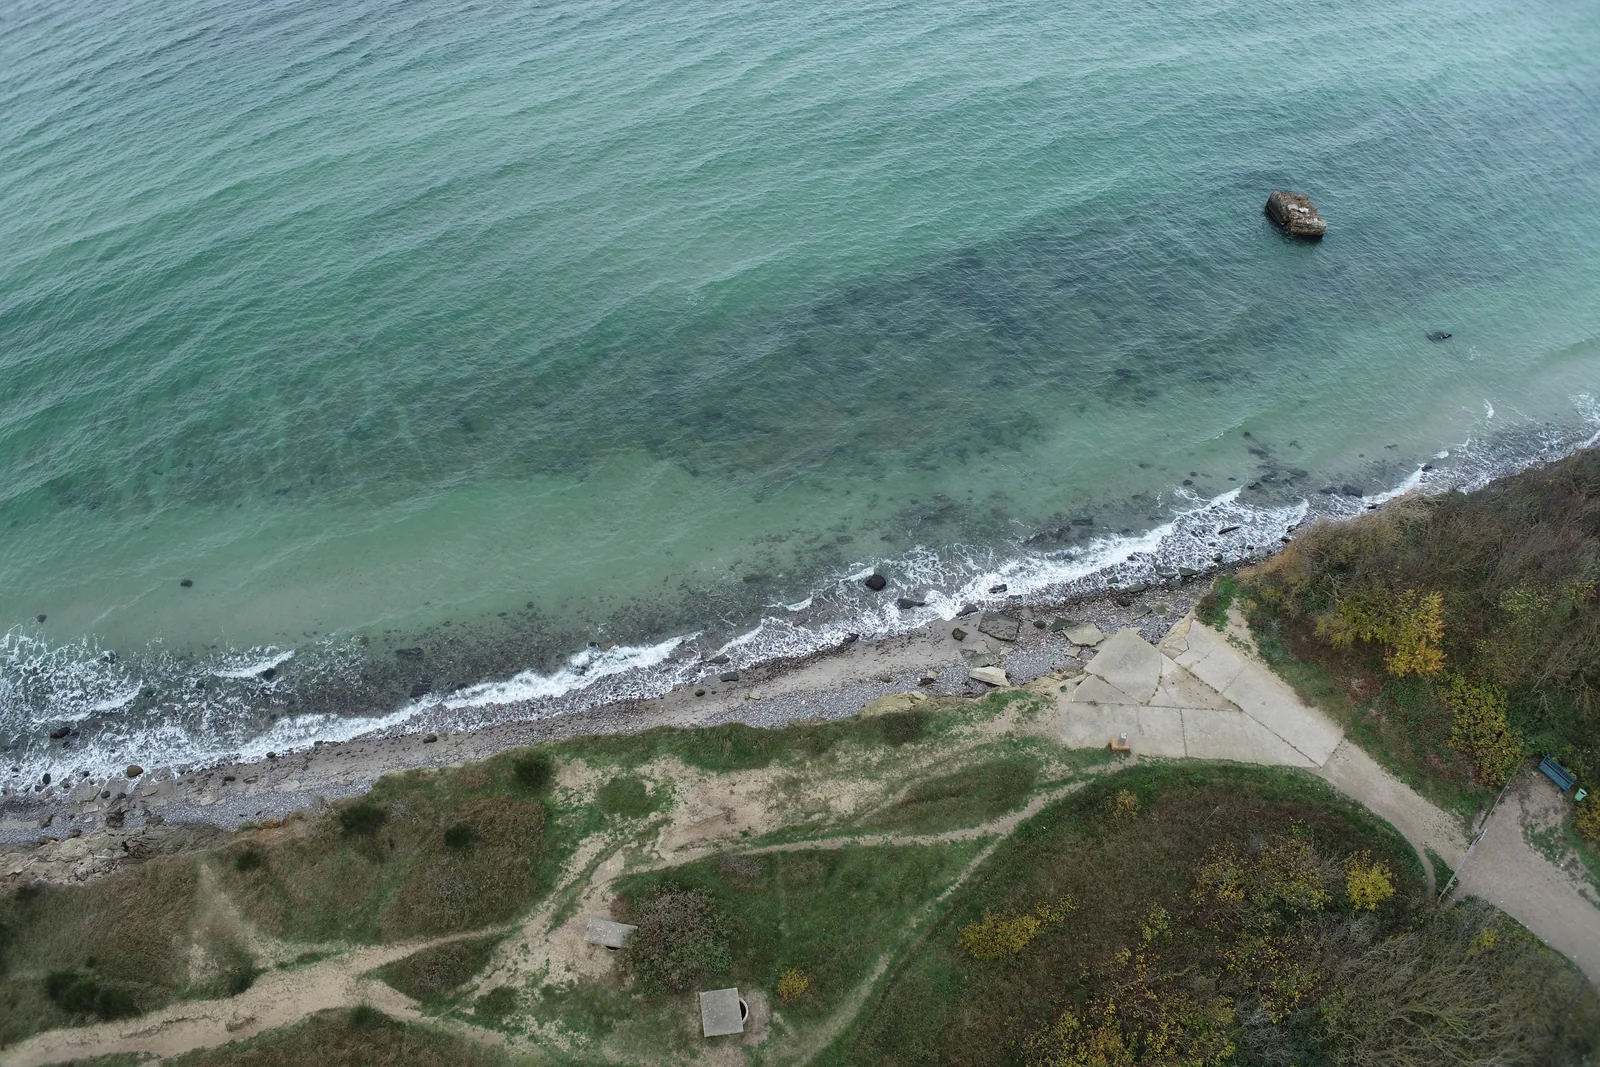
Hundreds of frames from one flight, each one overlapping the next. On their own they are just pictures of a place. These seven are real frames from the flight the next three steps were rendered from.
Live in production
Turn one drone flight into a site record you can inspect, measure, share, and keep.
Upload the photographs. Everything after that happens on our machines, and the files come back to you. Built and run by Eyona Software Development in Cape Town.
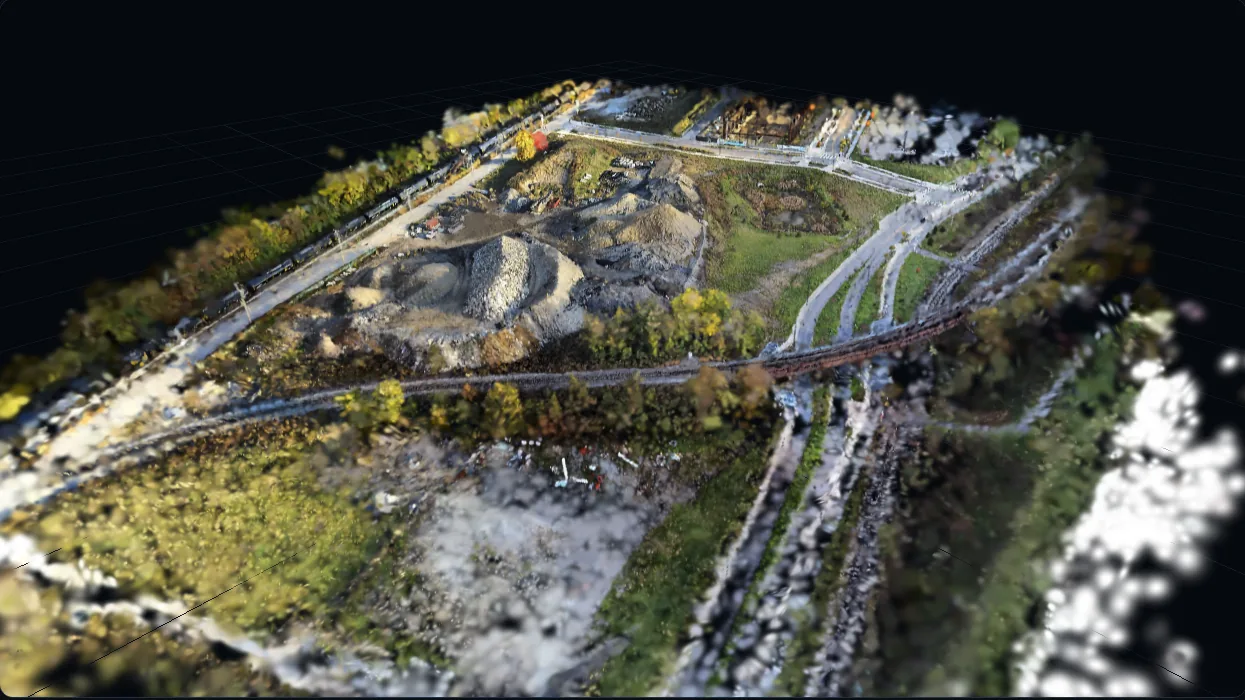
Above: a Gaussian splat Helios built from one real flight. It is a different site from the one used in the pipeline further down this page.
The folder of overlapping photographs from one flight, dragged straight off the drone into your browser. JPEG or TIFF. Nothing to install, no GPU of your own, no desktop licence.
The site rebuilt as a 3D scene you open in a browser, plus the eight files behind it: point cloud, mesh, orthomosaic, surface model, camera poses, splat, run log and a report. They are yours to keep.
One flight becomes a dated record of the site. Take distances, areas and elevations off it, send a link to a client with no login, and fly it again next month to see what changed.
02 The transformation
You hand over a folder from one flight. Everything below happens on our machines. Scroll to watch one real site move through the steps.
Step 01
Hundreds of frames from one flight, each one overlapping the next. On their own they are just pictures of a place. These seven are real frames from the flight the next three steps were rendered from.
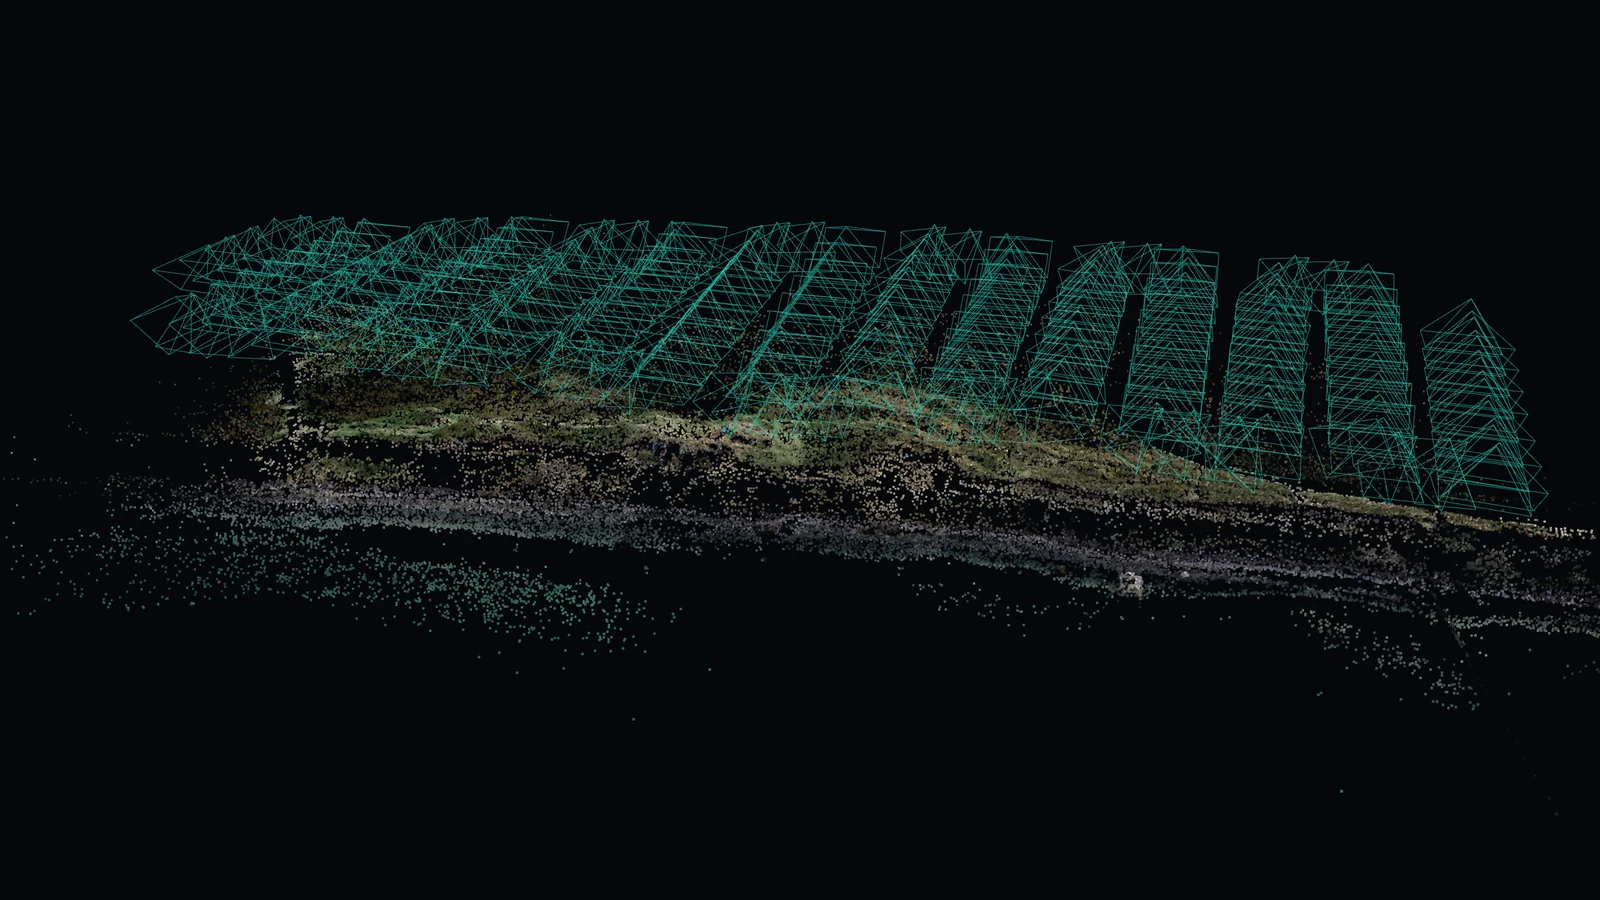
Step 02
The pipeline works out where every camera stood and where it was pointing, from the pictures alone. Every teal frustum above is one solved photograph: 297 of them on this flight, with 54,022 sparse points placed underneath.
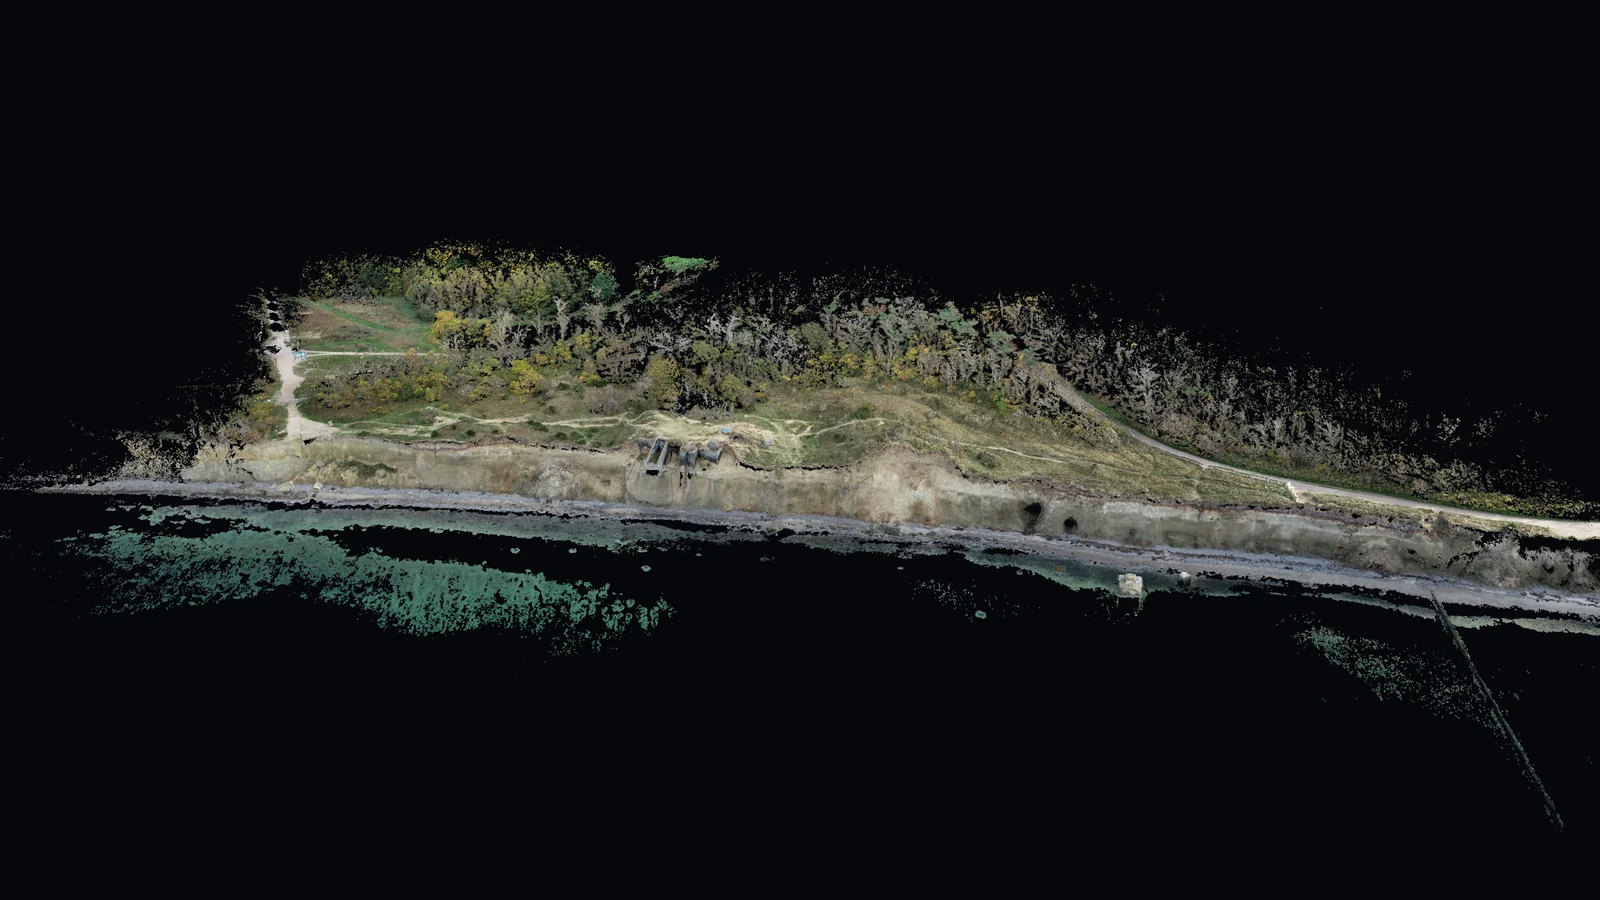
Step 03
Matching the same detail across many frames turns into millions of 3D points, 6,932,543 of them here. Look closely and the trees are still grains rather than surfaces. This is the first output in the run you can measure on.
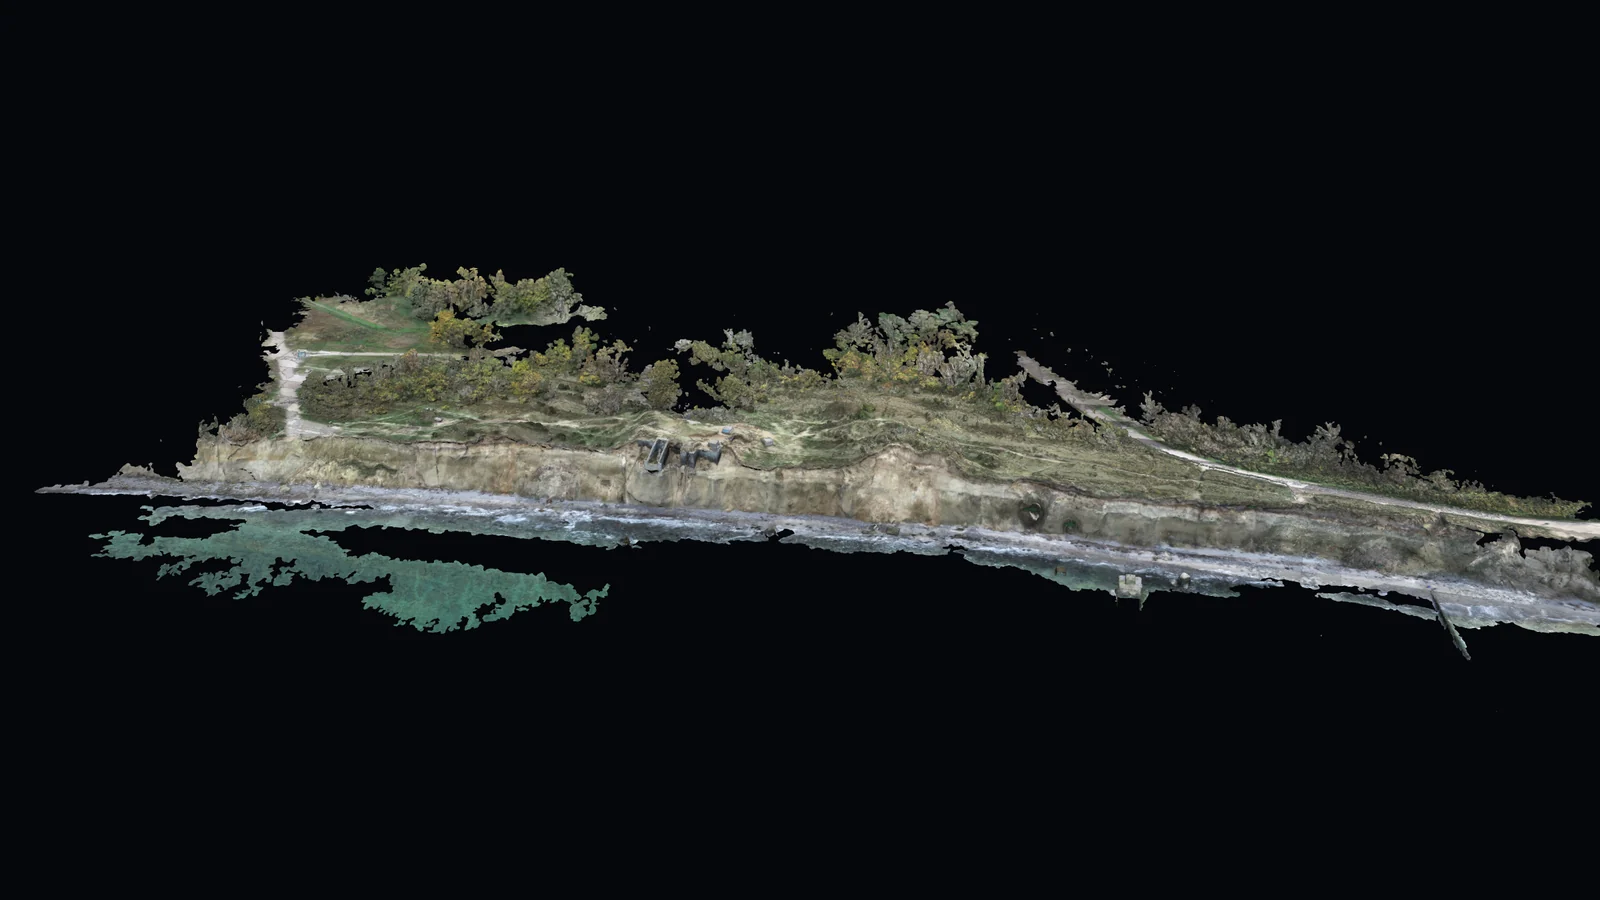
Step 04
The points become a continuous surface with the photographs wrapped onto it. The cliff face reads as solid strata instead of grains. This is what goes into CAD, a viewer or a game engine.
All four frames above are real renders of the same flight, held at one fixed camera position so the steps line up. Nothing there is one picture with a filter over it. The Gaussian splat runs as its own lane on the same upload and lands in the same results, listed in the outputs below.
03 Photograph and reconstruction
One frame from that flight, beside the reconstruction rendered from the exact camera position the pipeline solved for that frame. Scroll and the reconstruction sweeps across the photograph.
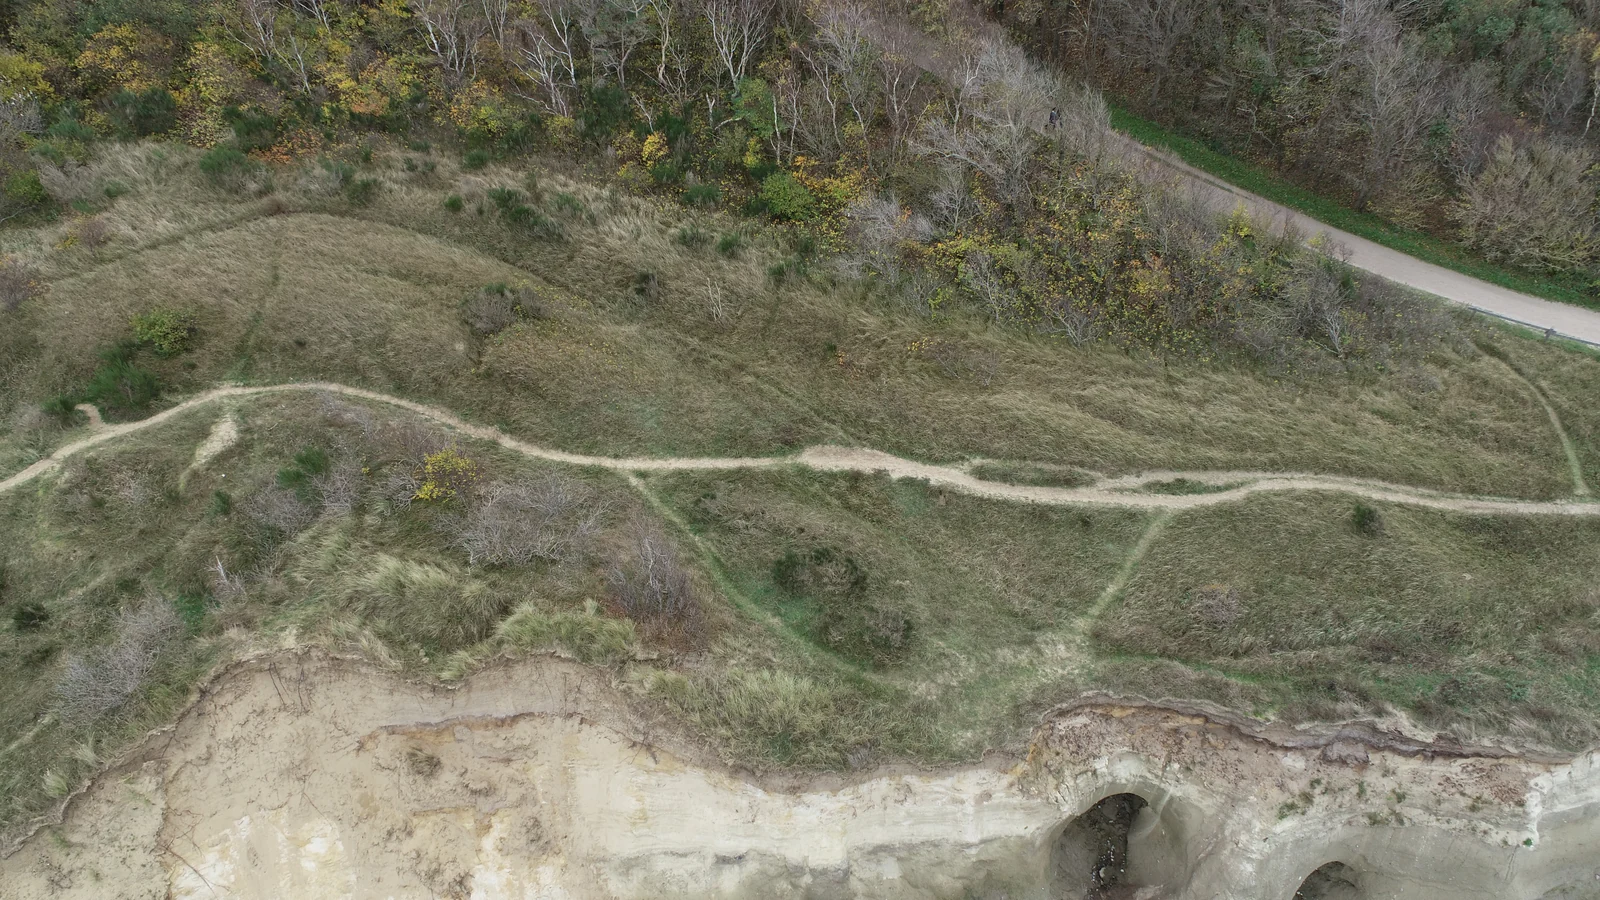
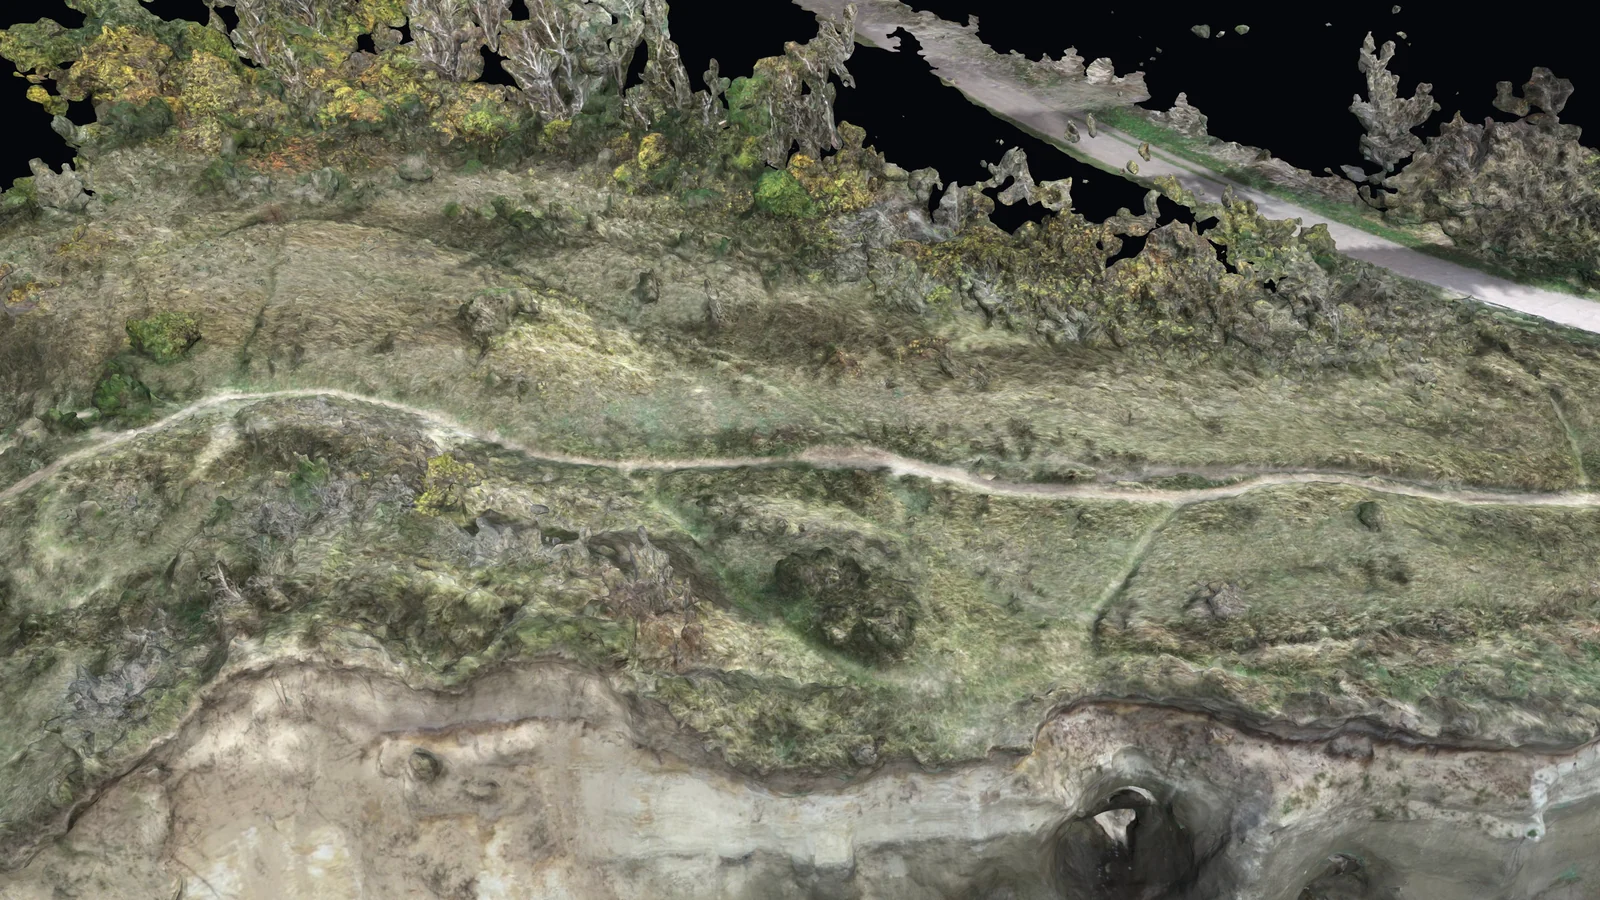
Both images are cropped identically, so the paths and the cliff edge run straight across the seam. Nothing here is enhanced or generated: where the reconstruction had no photographs to work from it shows nothing at all rather than inventing something.
04 What comes out
One flight produces one job, and one job produces every file below. Work in the browser viewers and download nothing, or take the lot. They open in the tools you already run, and nothing is locked inside a viewer you pay for next year.
| Output | Format | What it is for | Measurable |
|---|---|---|---|
| Dense point cloud | PLY / LAZ | Millions of 3D points. Distances, areas and volumes are taken on this. | ✓ |
| Textured mesh | OBJ / GLB / PLY | A continuous surface with the photographs on it, for measurement, CAD and viewers. | ✓ |
| Orthomosaic | GeoTIFF | The whole site flattened into one straight down image, ready to drop into a GIS. | ✓ |
| Digital surface model | GeoTIFF | Height at every pixel. Contours, slopes, cut and fill. | ✓ |
| Gaussian splat | PLY / KSPLAT | The scene you fly through in a browser. Photoreal, and never measurable. | no |
| Camera poses | COLMAP | Where every photograph was taken from. Reprocess in your own tools whenever you want. | - |
| Run log | JSON | Every stage the pipeline ran, its timing and its settings. | - |
| Report | The run, the numbers and the accuracy statement in one document you can hand over. | - |
Measurable means you can take readings on that output, in our viewers or in your own software. Scale is relative unless ground control is used. Georeferenced outputs carry a real coordinate system, taken from the flight's own coordinates and written into the file.
05 How it works
No desktop software, no queue you cannot see. Every screen below is the running product, captured from the live platform.
The dashboard is the whole organisation on one screen: what is running right now, how many results have been delivered, and the median turnaround measured across those runs rather than estimated. Every figure on it is read from our own flights.
Live status, measured numbers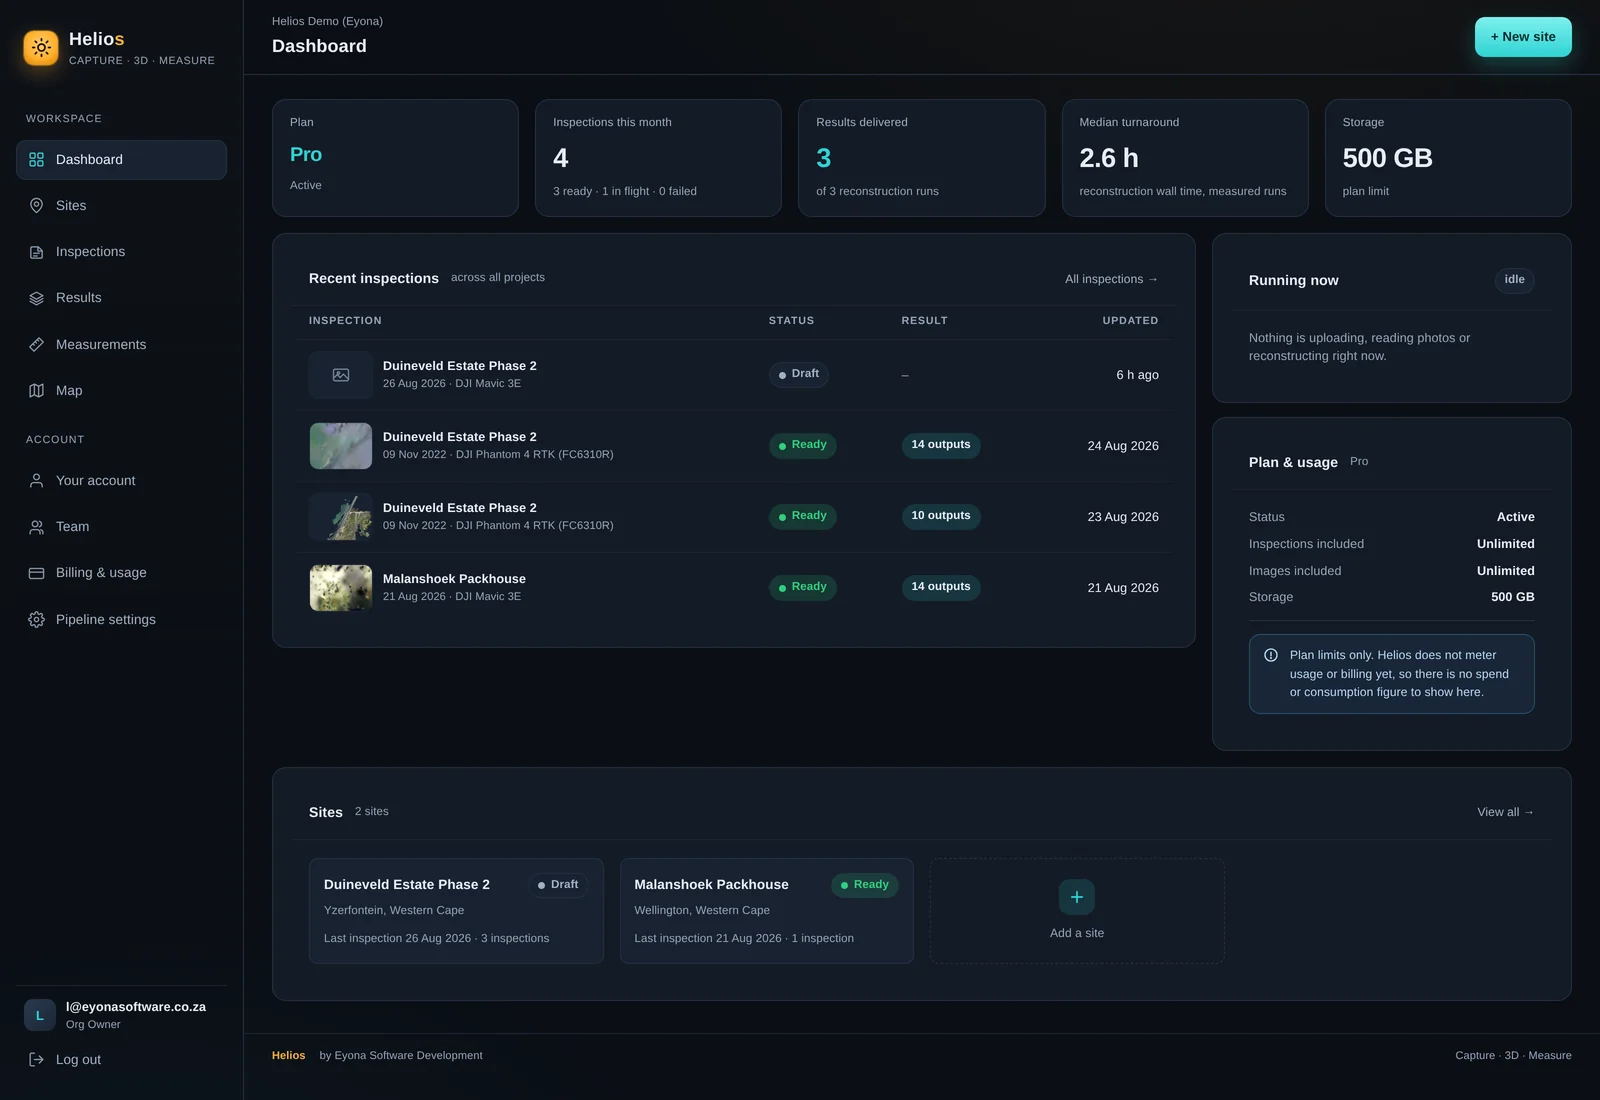
A site is a place you fly. Every inspection you run there stays filed against it, so a year of flights sits in one list with its state, its outputs and the day it last moved.
Sites, inspections, results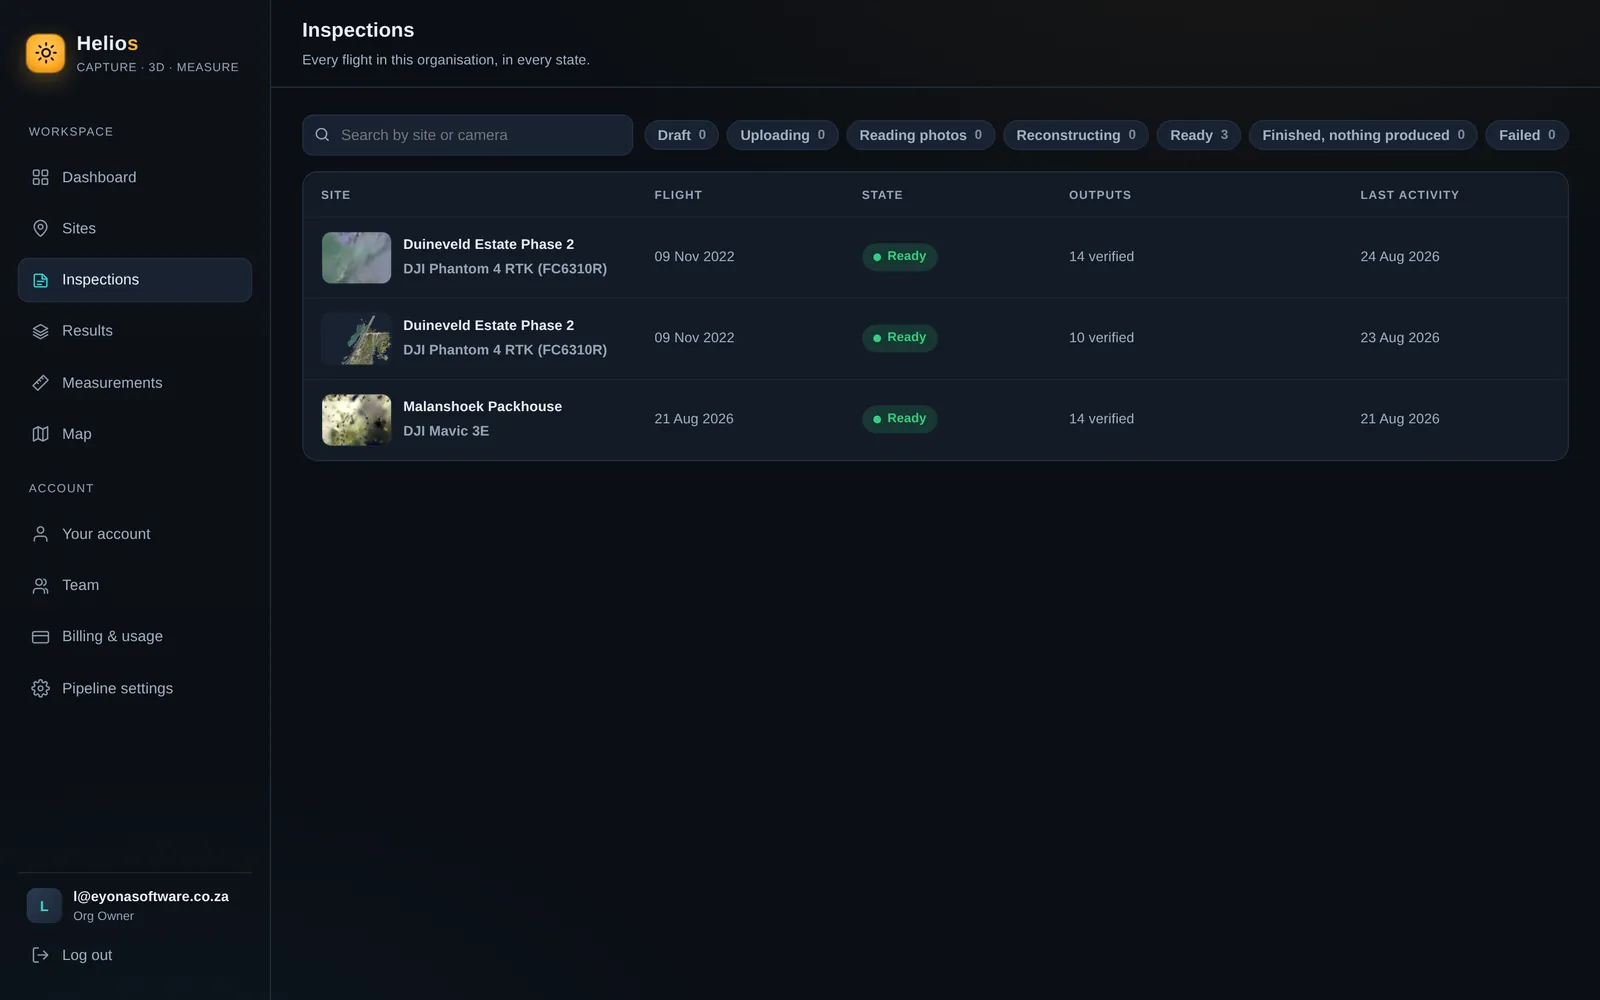
Drag the folder straight off the drone into the browser. The server checks each file rather than guessing in the page, and DJI payload pairs, the _T and _W frames, are matched automatically. Nothing processes until you hand the upload off.
JPEG or TIFF, resumable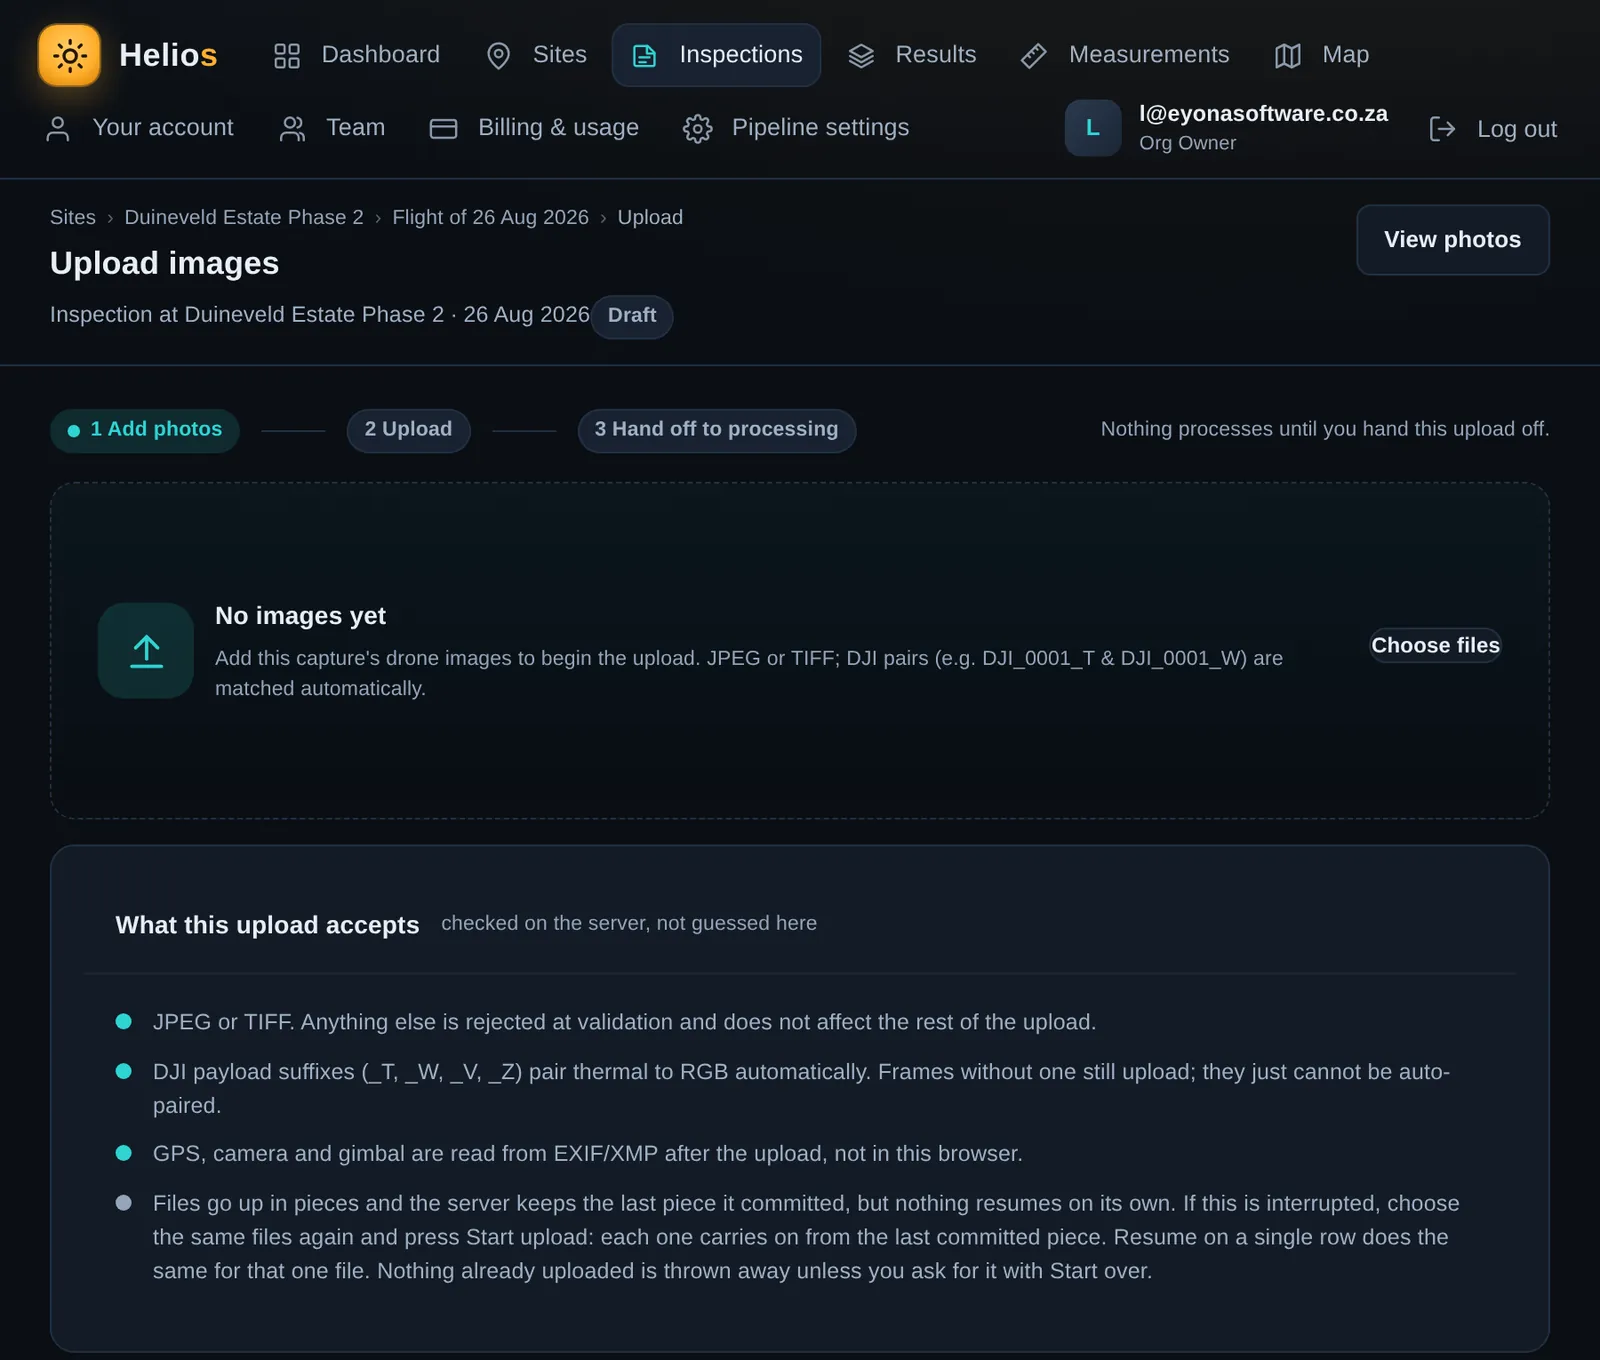
Photoreal, measurable, or both. What you pick decides what the pipeline builds and what lands in your results. Nothing is queued until you decide.
Photoreal / Measurable / BothThe quote is fixed and it appears before a single photograph is processed. Accept it and the run starts. Ignore it and nothing happens, and nothing is charged.
Nothing processes until you acceptThis run, before anything starts
R
awaiting final pricingEvery stage reports live while the pipeline works, with its own timing and its own result. Median turnaround measured at about 2.6 hours across our runs. Bigger flights take longer, and they say so: the run below spent 252 minutes in photogrammetry alone, and the screen never leaves you guessing.
Live stage progress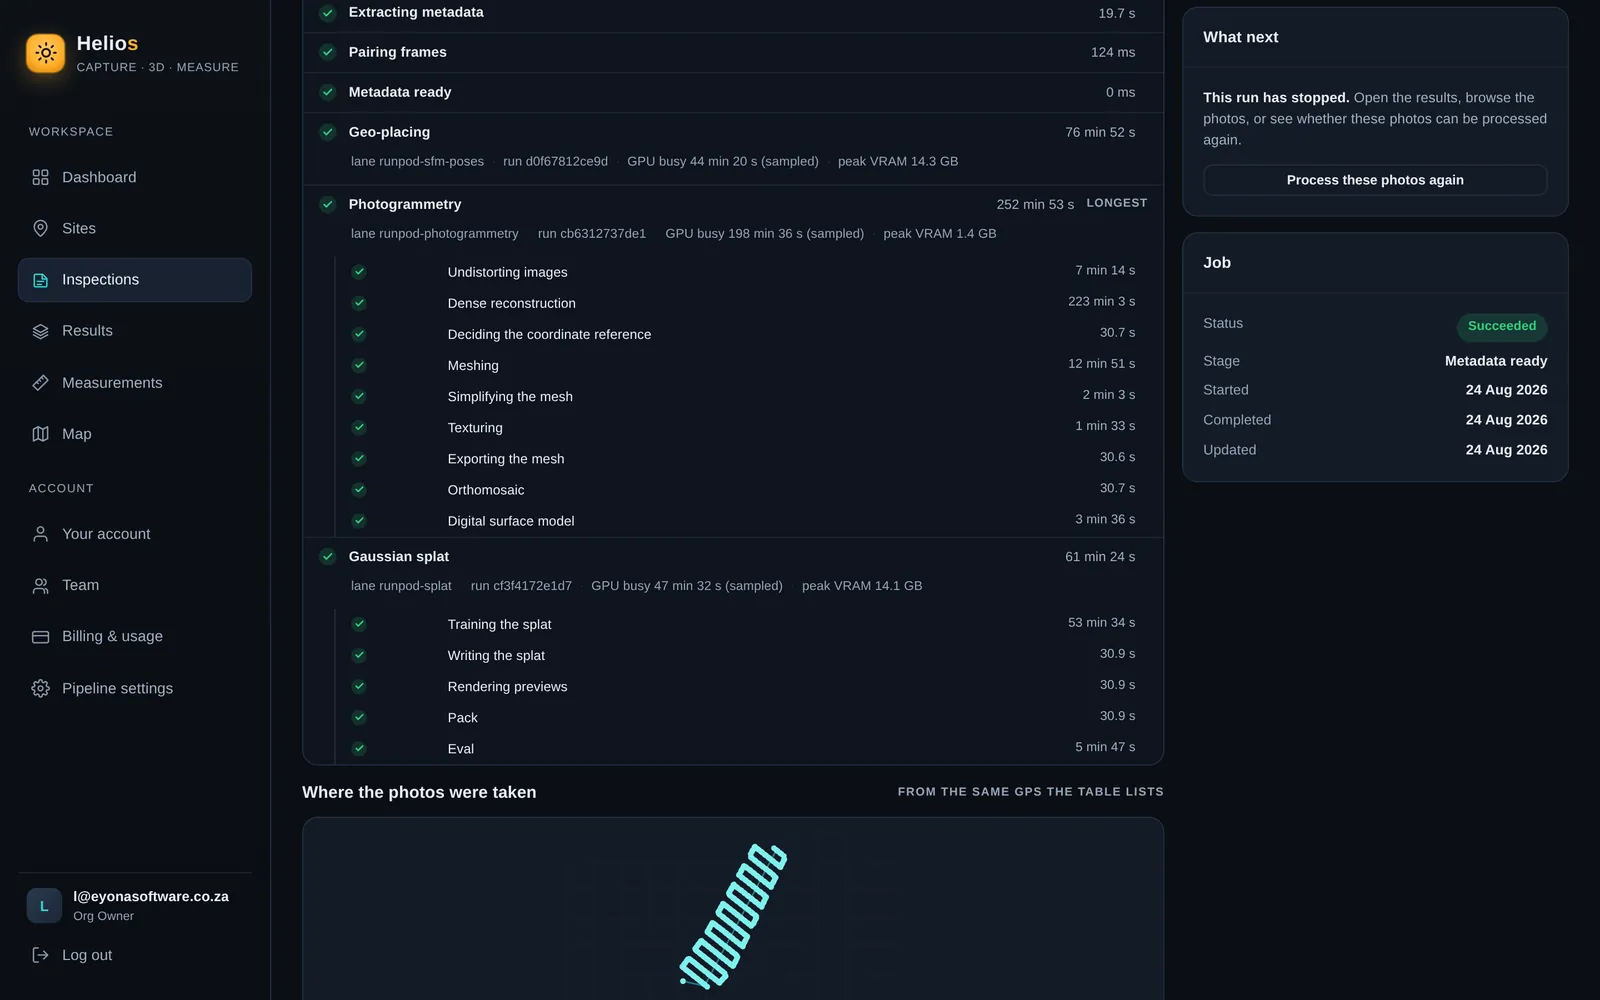
The finished scene opens in the same browser, in the viewers below. The files are yours to download and keep, and a share link puts them in front of your client without an account.
See the viewers below06 In your browser
One 3D viewer for the mesh, the point cloud and the splat, and a map view for the orthomosaic and the surface model. Measurement lives inside the viewers.
Open an output, then take distances, areas and elevations on it and save them with the job. Every row on the right is the platform's own record of a file it produced and checked: the type, the size it measured, and a checksum it computed itself.
Results screen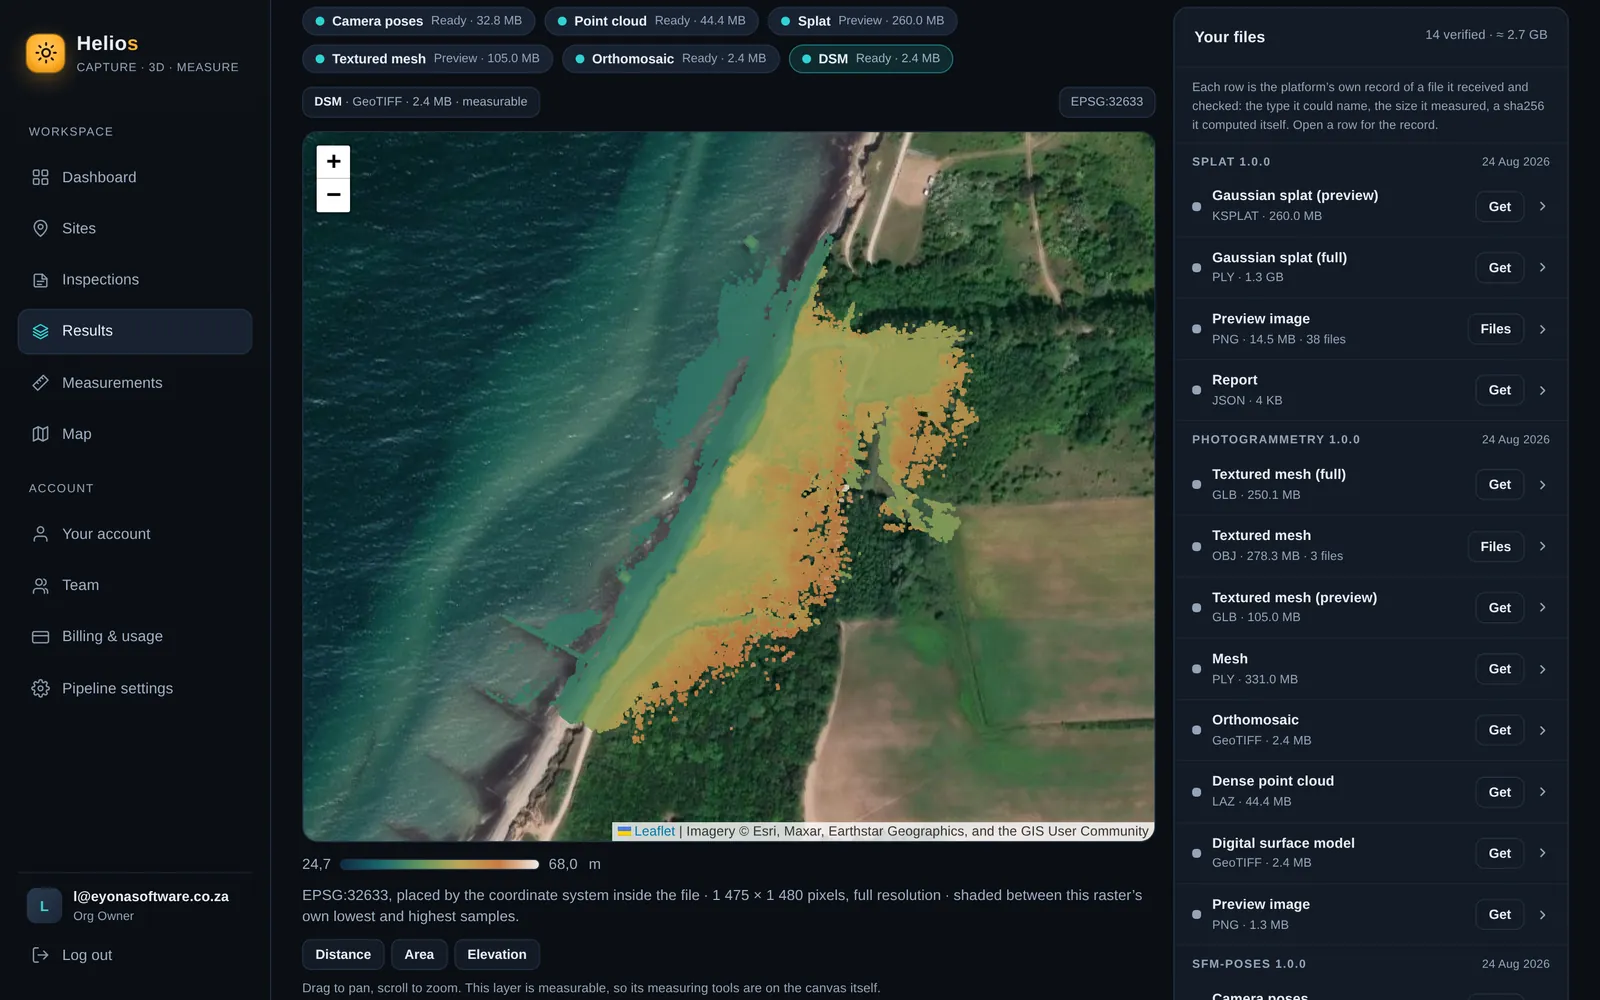
The orthomosaic and the surface model sit at the site's own coordinates on a satellite basemap, so a person who was never on site can find the job before they open it.
Map view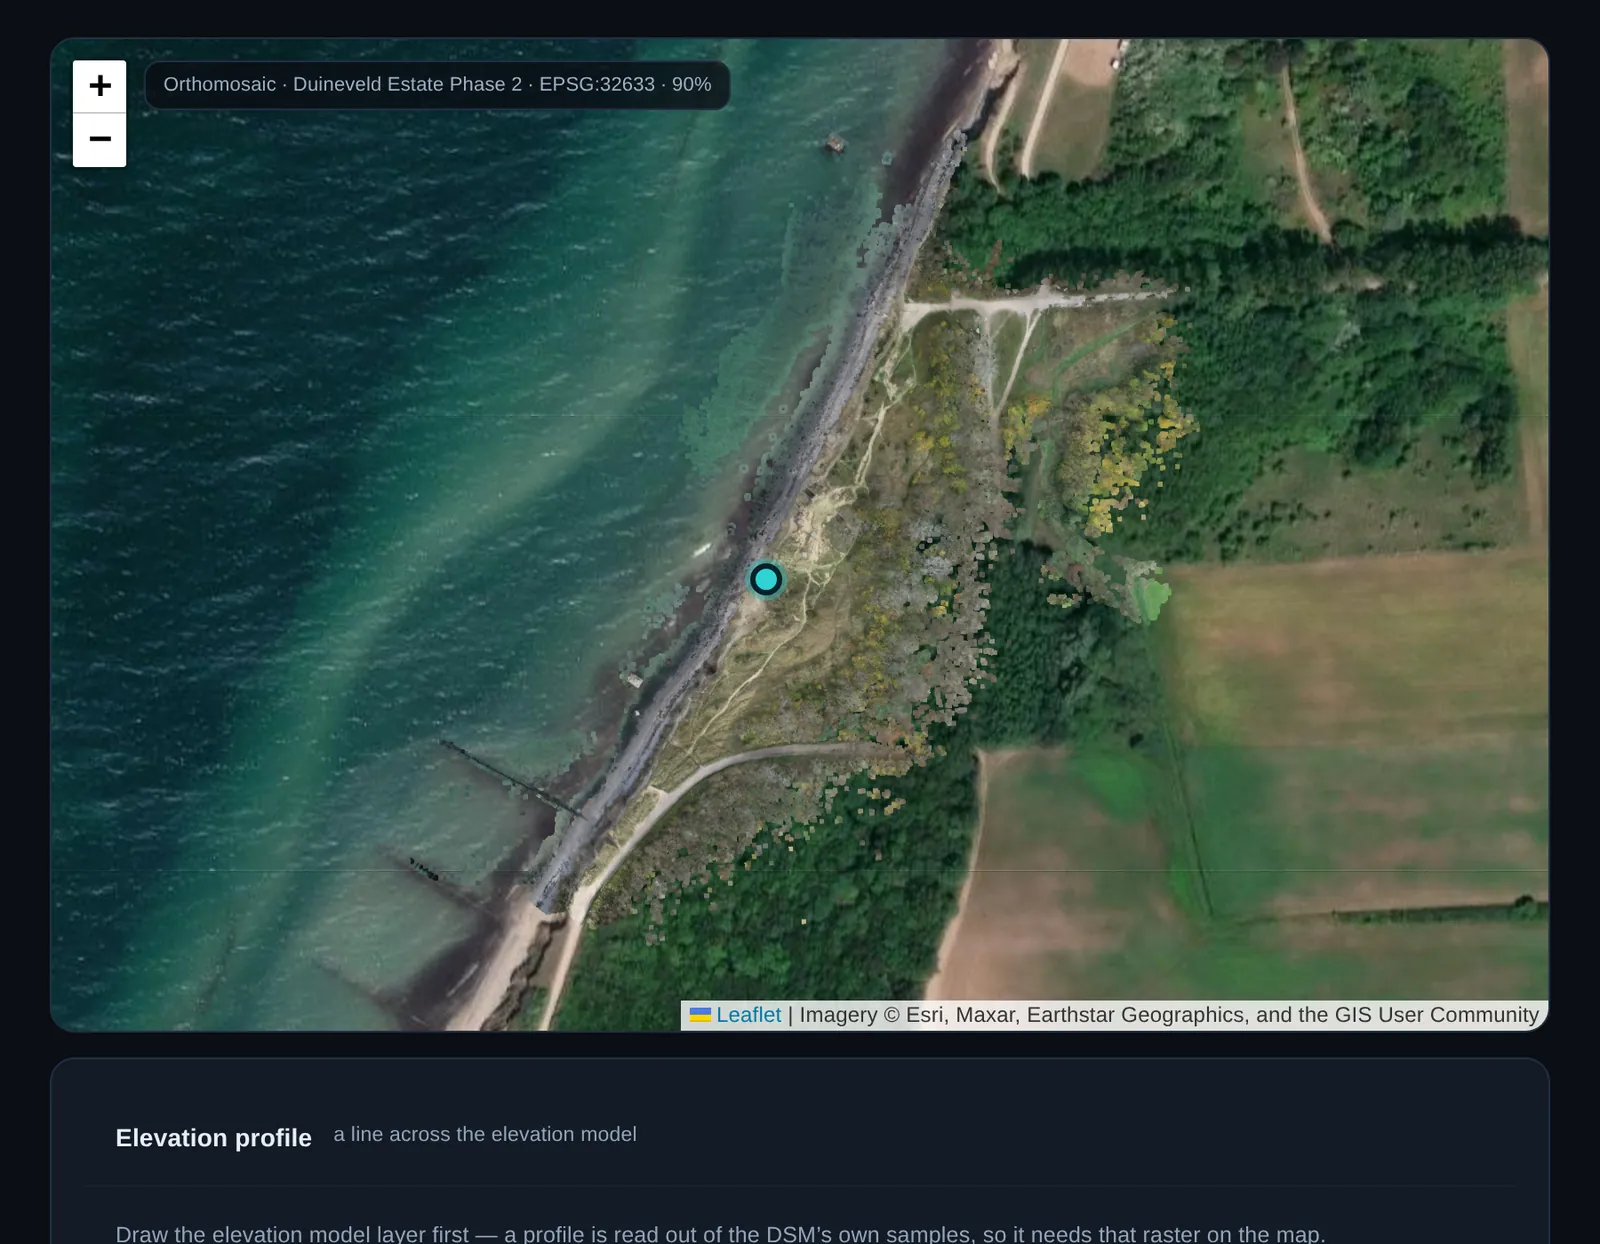
A share link opens the outputs, the numbers and the accuracy statement in any browser. No login, no account to create, and you choose how long it lives.
Expires after 7, 30 or 90 days07 Measured, not promised
We have no logo wall to show you, so here is a measurement instead. Thirty two camera views were held out of training, the finished model was asked to render those exact viewpoints, and each render was compared to the photograph it had never seen.
From our own aerial runs, separately: 1,657 of 1,657 camera positions solved on one flight, 840,206 gaussians in that scene, and 4,301,711 gaussians in the largest scene built so far.
Scene: Truck, from the public Tanks and Temples benchmark, run through our production splat pipeline at 30,000 iterations. Reference: Kerbl et al. 2023, same scene.
What this number is notPSNR is image fidelity, how close a render sits to the photograph. It is not a survey accuracy, and nothing on a splat is measurable. Measurements are taken on the mesh or on the point cloud.
What the scene is notTruck is a ground level public benchmark scene, not one of our aerial jobs. It shows our pipeline is sound against a published reference on identical input. It does not predict what any one site will score.
08 A finished scene
The splat at the top of this page is a working quarry. Below is the same site in the Helios viewer, captured off the canvas as it drew: the whole scene, then straight down, then in close on the stockpiles. One flight, three camera positions.
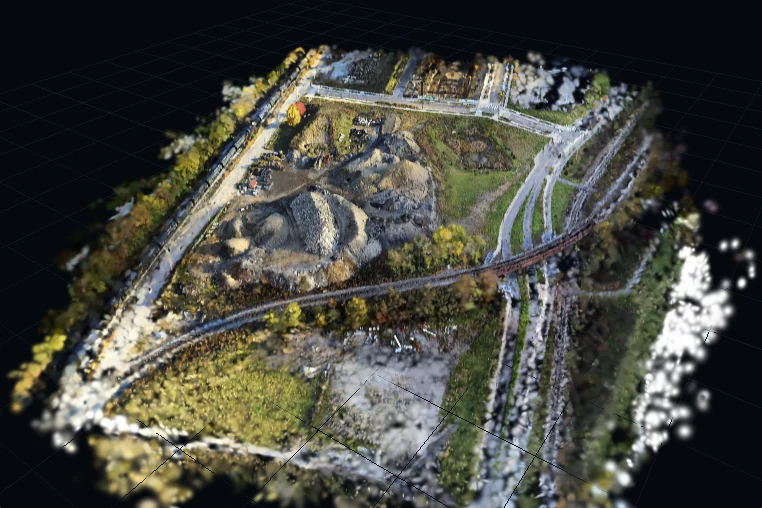
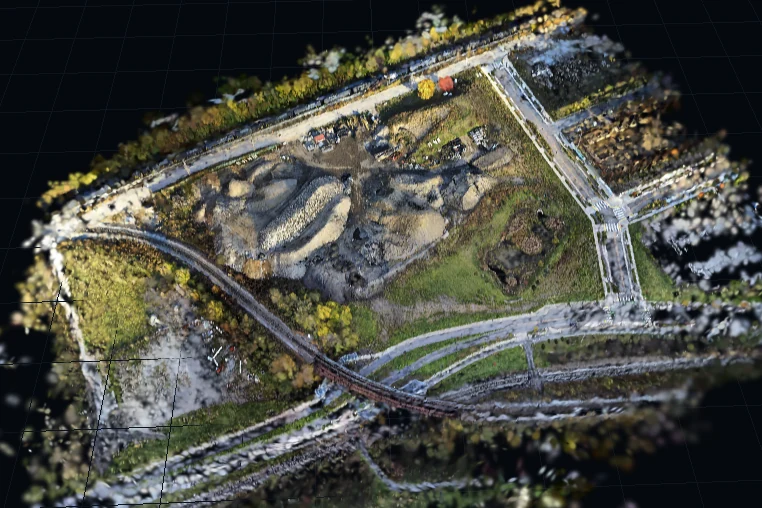
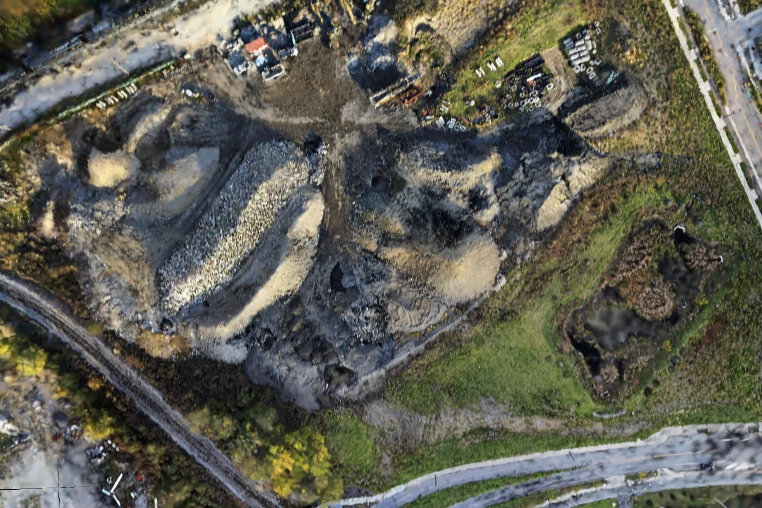
You turn, zoom and pan this yourself in the browser, and a share link puts the same scene in front of a client with no login. A splat is a picture of the site, so nothing on it is measurable: distances, areas and volumes come off the mesh or the point cloud from the same job.
09 How the money works
Four mechanics, and they do not change from job to job.
The quote appears before a single photograph is processed. You accept it or you do not. Nothing starts on its own.
The job is billed when the files are delivered and verified. Not on upload, not on start, not on the attempt.
If the pipeline does not deliver, there is nothing to pay. The risk of a bad run sits with us.
No monthly plan, no seat licence, no lock in. You pay per job, and only for jobs that deliver.
Per job pricing is quoted by email while we finish the public price list. Tell us the site, the drone and roughly how many photographs, and a fixed quote comes back.
10 Who it is for
Stockpile volumes and month on month change, taken from a flight instead of a walk over the pile. Stockpile volume measurement.
Progress records, as built geometry and handover evidence, dated and kept. Construction progress monitoring.
A condition record of a roof or a facade without sending anyone up there. Roof inspection.
Point cloud, digital surface model and orthomosaic, handed straight off into CAD. Drone site survey and photogrammetry services.
Panel level inspection across a plant, from the same flight.
Coming later, not shipped yet11 The honest part
If a job needs proven accuracy, say so before you fly. We will tell you what that takes, or we will tell you we are not the right fit for it.
12 Questions
Eight files: the dense point cloud, the textured mesh, the orthomosaic, the digital surface model, the Gaussian splat, the camera poses, the run log and a PDF report. They are yours to download and keep.
Median turnaround measured at about 2.6 hours across our runs, and you watch every stage report live while it works. A large flight can run considerably longer, and the progress screen names the stage it is on and how long that stage has taken.
A fixed quote is shown before anything runs, you are charged on delivery only, a failed run costs nothing, and there is no subscription. The public price list is still being finalised, so email us for a fixed quote on your flight.
Yes, inside the viewers: distance, area and elevation on the orthomosaic and the surface model, point to point on the mesh, and measurements can be saved with the job. Never on the splat, which is a picture and not a surface.
No. A share link opens the outputs, the numbers and the accuracy statement in any browser, with no login. You choose whether the link lives for 7, 30 or 90 days.
JPEG or TIFF from a single flight, uploaded in the browser and resumable if the connection drops. DJI payload pairs, the _T and _W frames, are matched automatically. Current capacity is about 1,200 photographs for camera poses and about 300 per splat.
No. There is no AI enhancement anywhere in the pipeline. Every pixel in every output is reconstructed from the photographs you uploaded, and nothing is imagined by a model.
13 Next
Tell us the site, the drone and roughly how many photographs. We come back with a fixed quote for the job before anything runs.
Helios is live in production and running real flights today, at helios.eyonasoftware.co.za. The pipeline, the viewers, the map and the billing run are all in service.
The public price list is being finalised, so jobs are quoted by email in the meantime. Solar panel inspection is a later module and has not shipped yet.
Helios runs at helios.eyonasoftware.co.za